
50 ways to compare weather
Precipitation in the US corn belt

If you are interested in chatting about this type of analysis please get in touch via email here, LinkedIn, or just book a meeting here! Also please consider subscribing to make sure you don’t miss out on any posts!
“Climate is what we expect, weather is what we get.” - Mark Twain
🎯 Key Takeaways
I compared PRISM and ERA5-Land precipitation aggregated to the county level over the US corn belt to see how divergent they were.
Differences are substantial:
Precipitation differences can exceed 400mm (40%) in some growing seasons
This can lead to large differences in yield models, depending on the data source used.
There are regional patterns:
ERA5-Land tends to show higher precipitation than PRISM in northern regions (ND, MN)
PRISM shows higher precipitation in southern regions (MO, IN)
There are temporal patterns too:
Dataset differences aren't consistent year-to-year
Some regions show highly unstable biases, particularly along state borders with Missouri state.
Why Do We Care?
Global agricultural production is under threat from increases in precipitation extremes under the intensifying water cycle due to climate change. The US is the world’s largest maize producer, supplying over 30% of the global maize production and has experienced climate extremes that have caused substantial damage to maize.
Drought and excessive rainfall are the two largest causes of maize production loss in the US, totaling a combined 28 billion US dollars in losses in the period from 1989 to 2016. As a result, understanding the relationship between precipitation extremes and corn yield is key to modeling and assessing what future yields will look like in a changing climate.
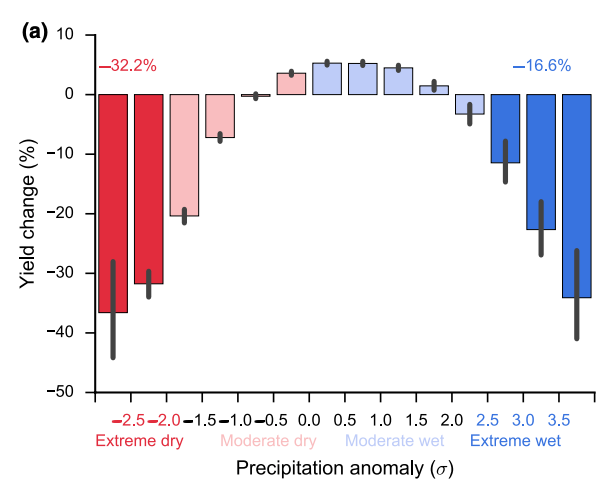
A paper by Li et al. (2019) showed that excessive rainfall can slash corn yields by up to 34% compared to expected yields - almost as devastating as the 37% reduction in yield caused by severe drought.
While these results are striking, they could potentially look very different if we used a different precipitation dataset! Variability in precipitation estimates leads to variability in the estimation of the effect of precipitation on crop yields, which is key in evaluating future crop yields under different climate scenarios.
Gridded weather products, unlike satellite observations, are usually analytically derived products used to interpolate between point observations. What this means is that there’s a whole lot going on spatially in between weather stations/observations that is not actually physically observed for any given time step in the data! This is why I thought it’d be interesting to dig into the differences and potential effects that differences between weather datasets can have on downstream models.
In this article we’ll be addressing this issue by comparing two precipitation weather datasets. We’ll look at the ECMWF Reanalysis v5-Land (ERA5-Land) and the Parameter-elevation Regressions on Independent Slopes Model (PRISM). I chose to compare these two datasets as they were readily available on the Google Earth Engine catalog, but this analysis could easily be extended to other datasets. I should also note at this point that PRISM is considered the gold standard in the US in terms of weather data, but many countries do not have an equivalent, and yield models are likely to use ERA5-Land/ERA5 in those areas.
⛰️ERA5-Land
ERA5-Land is a global reanalysis dataset produced by the European Centre for Medium-Range Weather Forecasts (ECMWF), that provides hourly estimates of land surface variables at 9km resolution. The dataset includes key atmospheric variables such as temperature, precipitation, soil moisture, and evaporation.
ERA5-Land combines weather forecast model output with observational data using ECMWF's Integrated Forecasting System (IFS). The system produces data through a sequential data assimilation scheme and incorporates observations from:
Satellite data from multiple platforms and sensors
Ground-based weather stations
Aircraft measurements
Marine buoys and ships
Radiosondes
For land surface variables, ERA5-Land enhances the base ERA5 atmospheric reanalysis by running the land component of the IFS at higher resolution. This produces improved detail in areas with complex topography and coastlines.
For this post we’ll be looking at the ERA5-Land Daily Aggregated product.
🌈⃤ PRISM
The PRISM (Parameter-elevation Regressions on Independent Slopes Model) Climate Group at Oregon State University creates high-resolution grid maps of meteorological variables including precipitation, temperature, dew point, and vapor pressure deficit.
The system processes data from approximately 20,000 weather stations daily. In this post we’ll use the Daily Spatial Climate Dataset (AN81d), which has a spatial resolution of ~4500m. For each grid cell in the final gridded product, PRISM analyzes data from 15-25 nearby weather stations, weighing each station's influence based on:
Distance from the grid cell
Physiographic similarity (elevation, coastal proximity, topographic position)
Climatic similarity
Radar data correlation (where applicable)
🌧️ Precipitation Methodology
In order to compare these two gridded datasets, we’ll constrain our study to the corn belt in the US, which consists of 12 states shown below.
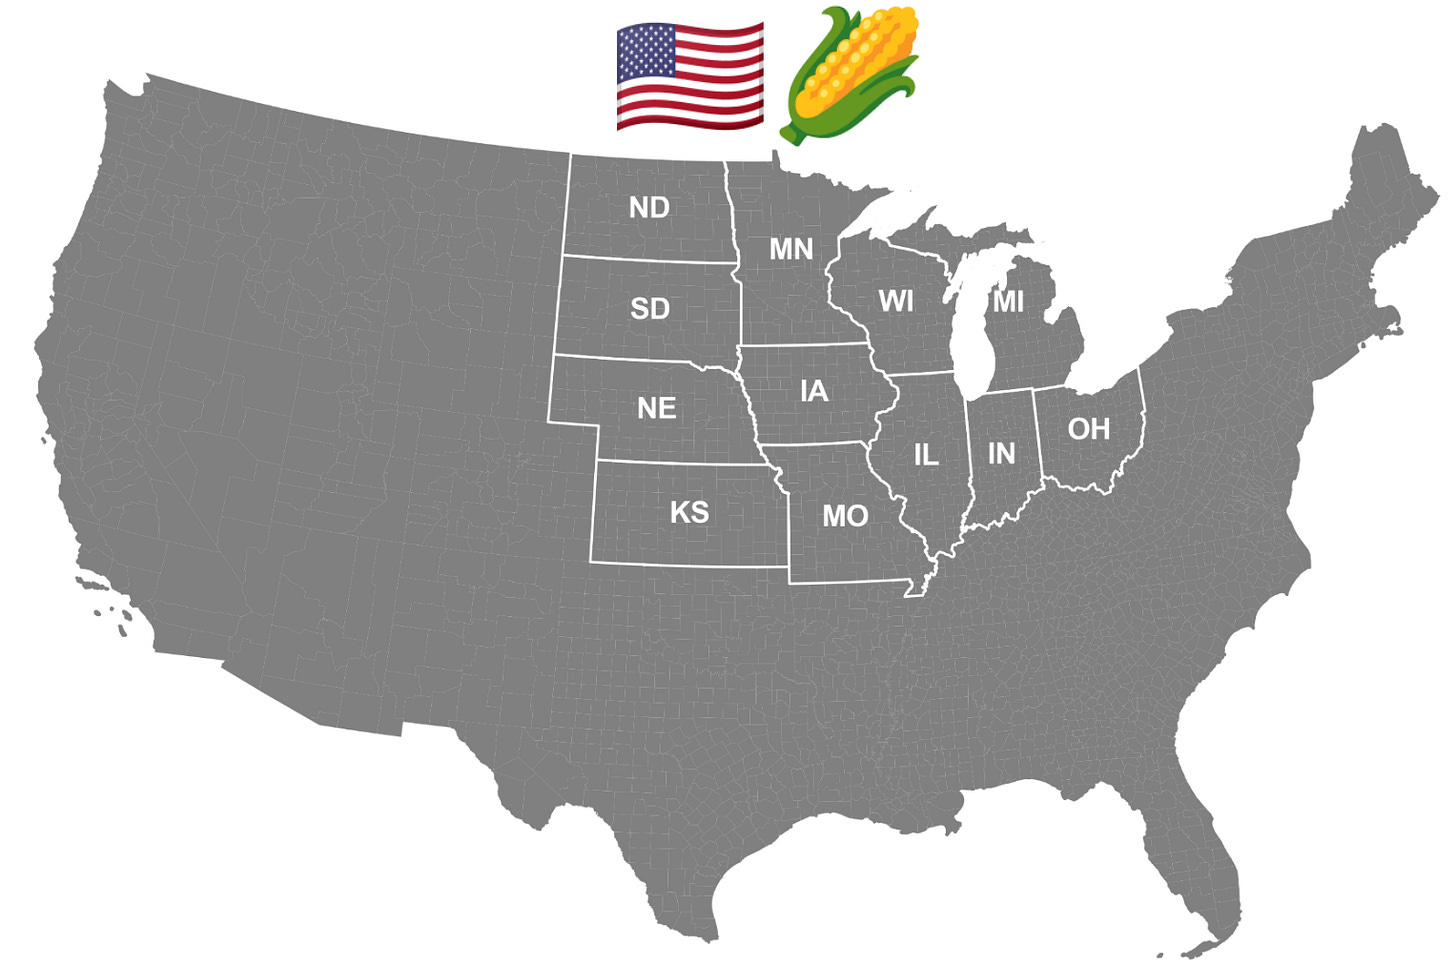
These are:
Illinois
Indiana
Iowa
Kansas
Michigan
Minnesota
Missouri
Nebraska
North Dakota
Ohio
South Dakota
Wisconsin
These states grow about 90% of all the corn produced by the US, or about 30% of the global supply! This area is relevant because in the US corn is primarily rain fed, with only approximately 15% of total acreage being irrigated as of 2007. As a result, precipitation is an important feature to include in any corn yield model.
The USDA NASS service provides corn yield data at the county level, so I chose to compare the two weather datasets at the county level as well, since this is the aggregation unit typically used when modeling yield.
I compared the datasets over a 24-year time-span corresponding to the corn growing season across the corn belt, including planting and harvest: from March to November for the years 2000 - 2024. In many of the figures below I’ve left 2024 out as it wouldn’t fit neatly into a grid, but I included it in all of the temporal aggregations we’ll discuss later.
⌛Comparing time-series - in time
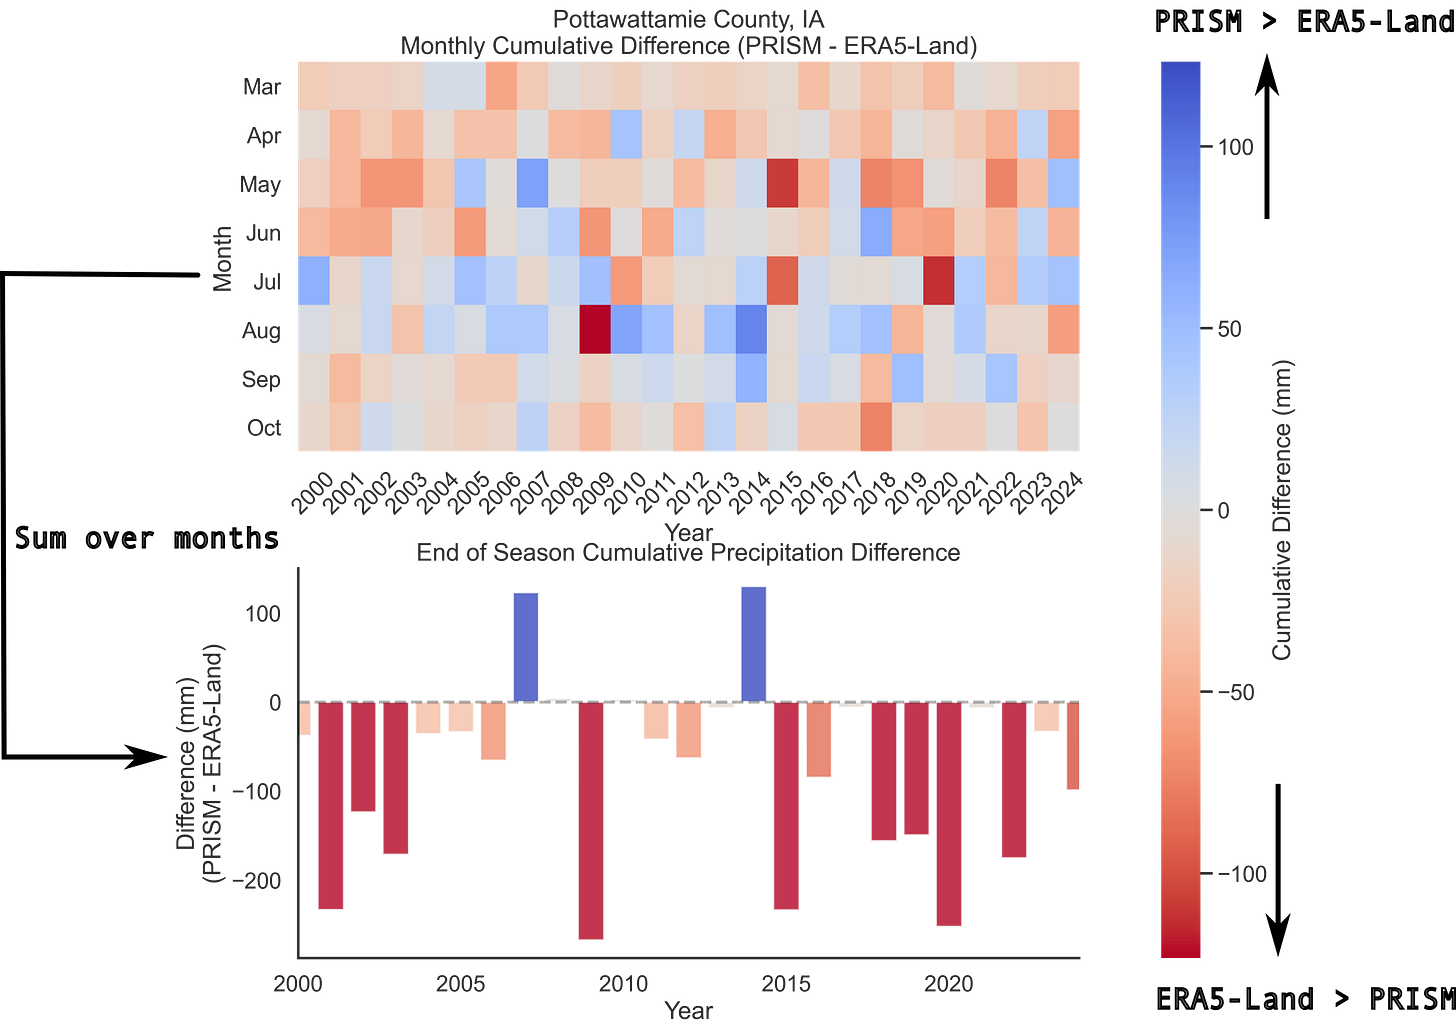
Before we dive in too deep, I just want to note that I initially thought this would be a very quick and easy post to get out: how difficult can it be to compare to weather datasets? As it turns out, it is pretty difficult. The temporal nature of the data tends to add complexity in unexpected ways. Let’s look at cumulative precipitation for both datasets for Pottawattamie County, Iowa for example:
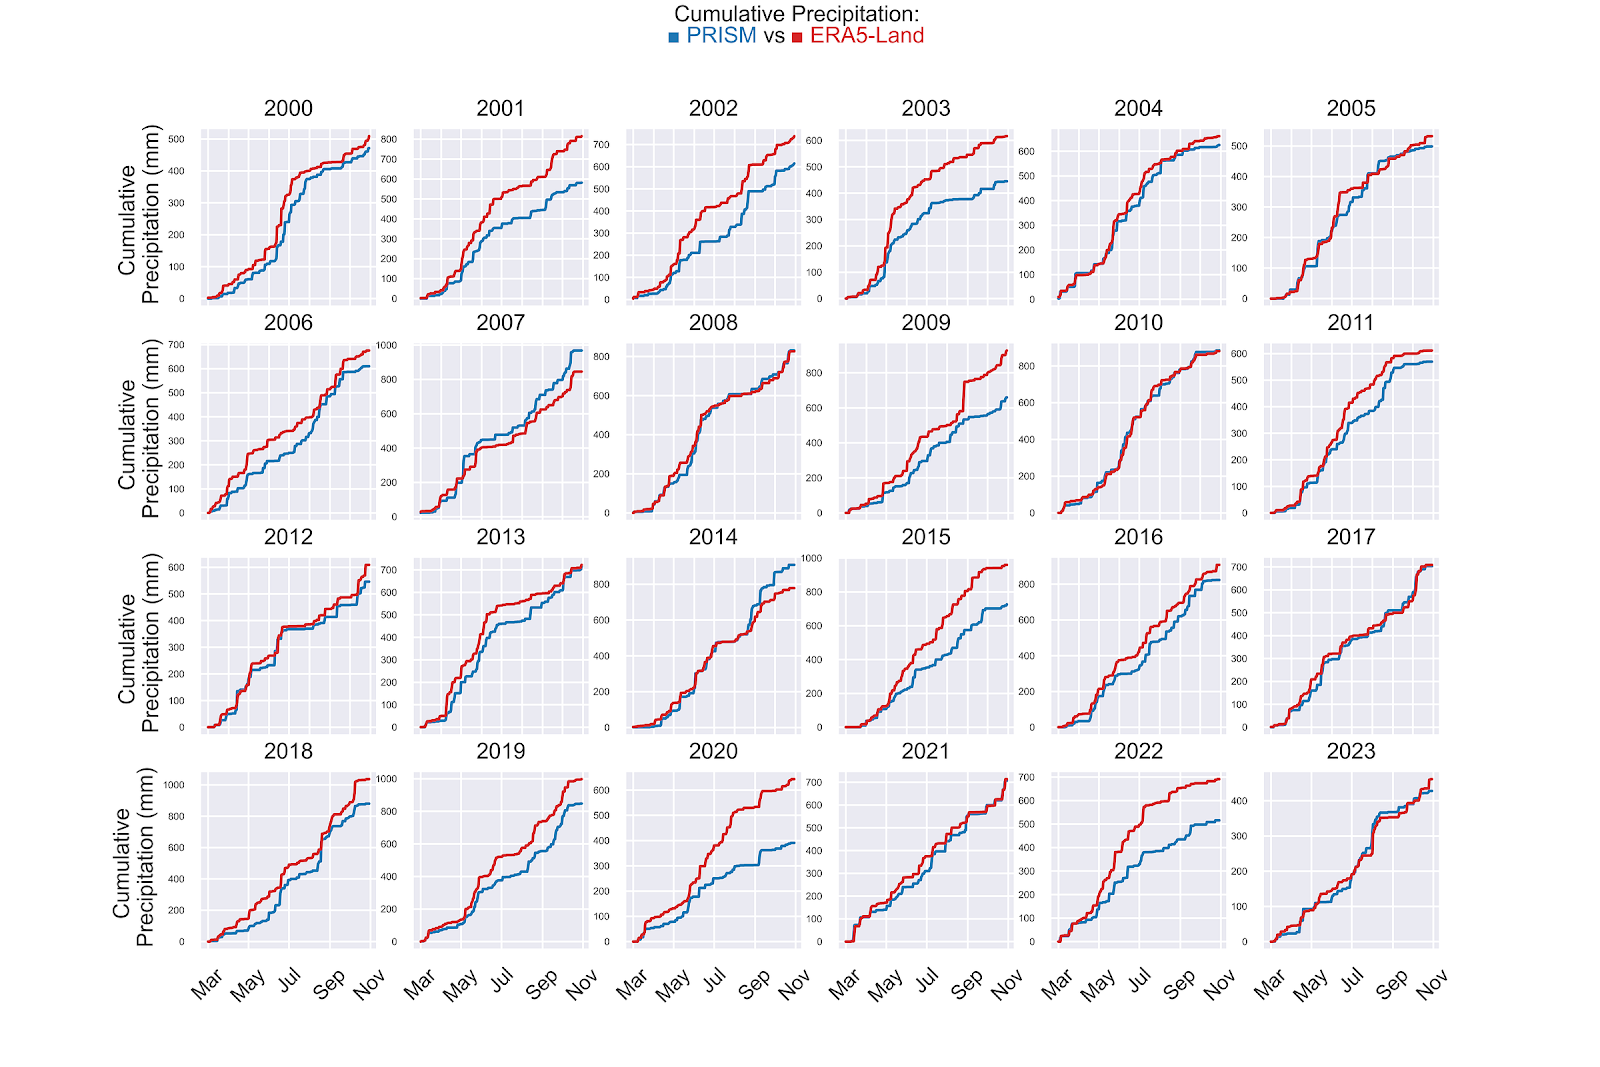
As the corn growing season progresses from March to November, for each year between 2000 - 2023, we see that disagreements in cumulative rainfall between PRISM and ERA5-Land tend to be variable throughout the season. We could simplify this task by taking the difference between PRISM and ERA5-Land end of season precipitation. This unfortunately would not capture the entire picture of the divergence between the datasets, which is more evident when we look directly at the difference between cumulative sums in precipitation:
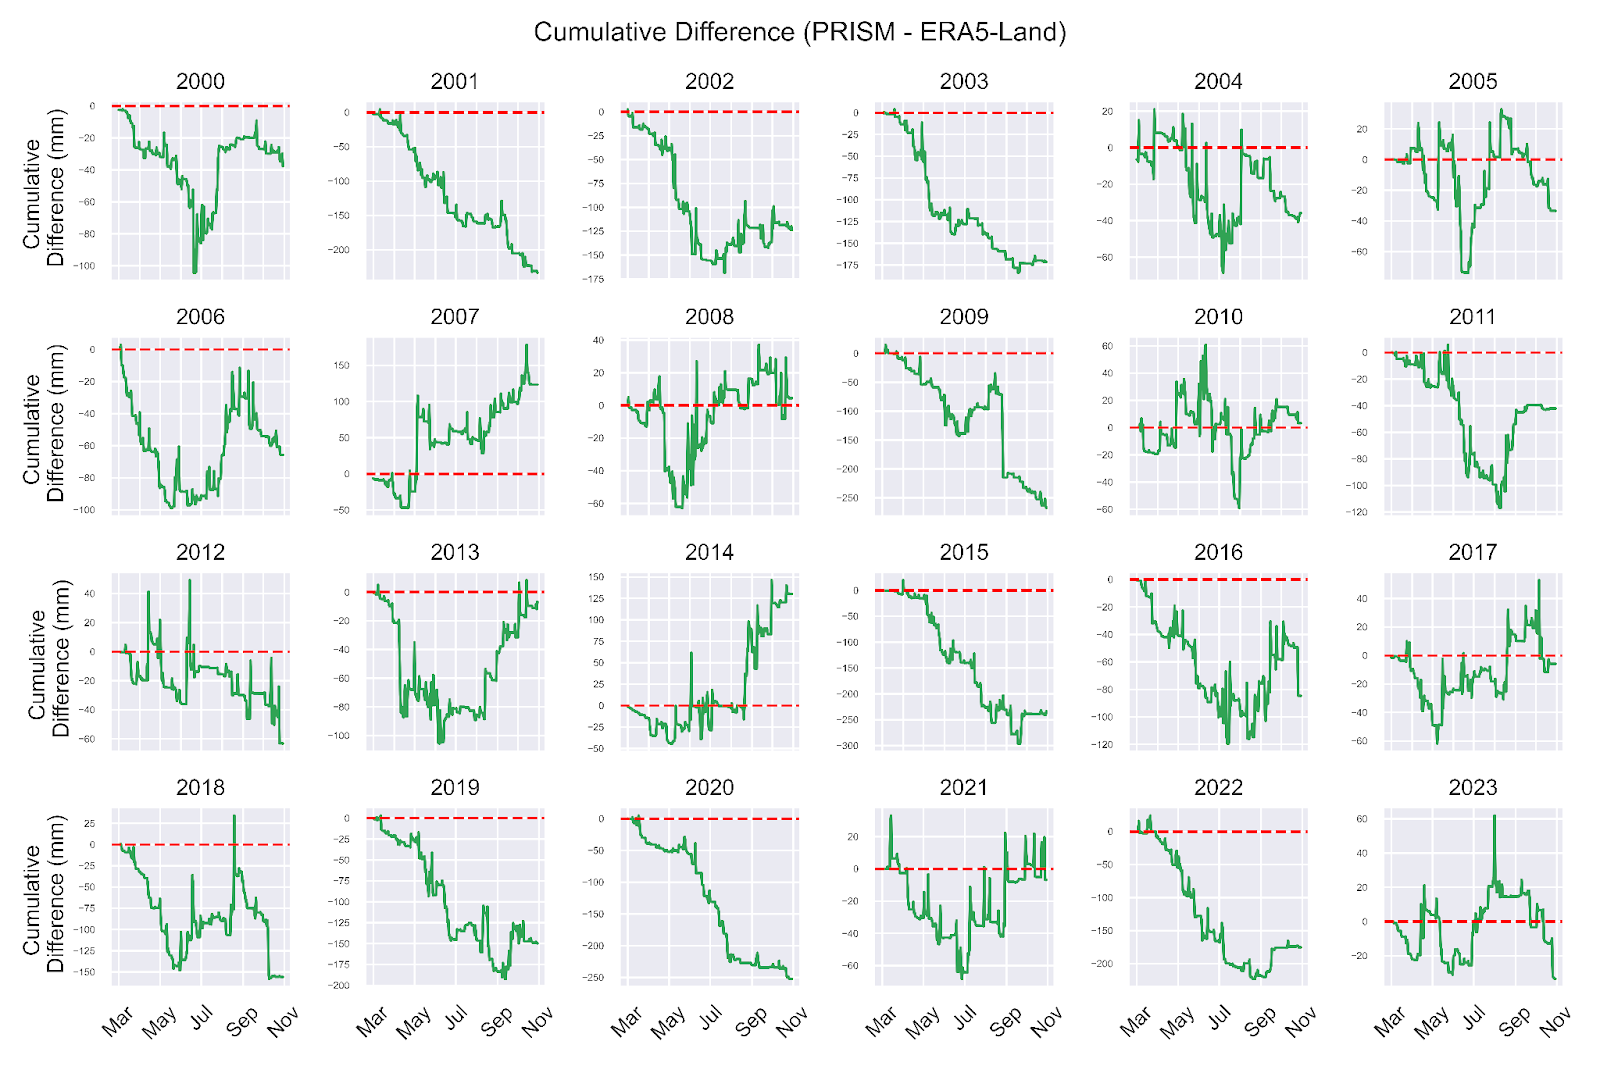
To further illustrate why simply taking the difference between PRISM and ERA5-Land end of season precipitation does not capture the full picture, let’s compare monthly differences and total differences. In the plot below I summed precipitation over individual months and over the entire season total, and calculated their difference between the datasets. We can see that in some months ERA5-Land precipitation exceeds PRISM precipitation for Pottawattamie County ( the red months), and during others the inverse is true (the blue months)! We also see that these differences vary from. year to year.
In this section I’ve hopefully illustrated some of the many ways in which one could compare these two datasets. For the remainder of this post, we’ll specifically look at the cumulative difference, or bias over the whole growing season, as I feel like that’s probably the simplest way to extend these results to multiple counties and years. It’s also been pointed out to me by a particularly meticulous proof reader that I use the terms ‘difference’ and ‘bias’ interchangeably throughout this post: here I’ll use the term bias to mean PRISM precipitation - ERA5-Land precipitation.
🗺️ Comparing time-series - in space
We want to look at all of the counties in the corn belt, so we’ll need to aggregate cumulative precipitation for all counties, for both PRISM and ERA5-Land, over our 24 year dataset. While this seems like a heavy lift, aggregating these values at the county level is fairly easy thanks to Google Earth Engine, which contains both datasets in its catalog. For a single year, we can then easily look at spatial patterns in the differences in cumulative precipitation: here we’re looking at both the absolute bias, measured in millimeters, as well as the relative bias given as a percentage.
As you can see, differences between the datasets can be pretty large for given counties, up to > 40% or 300mm !!
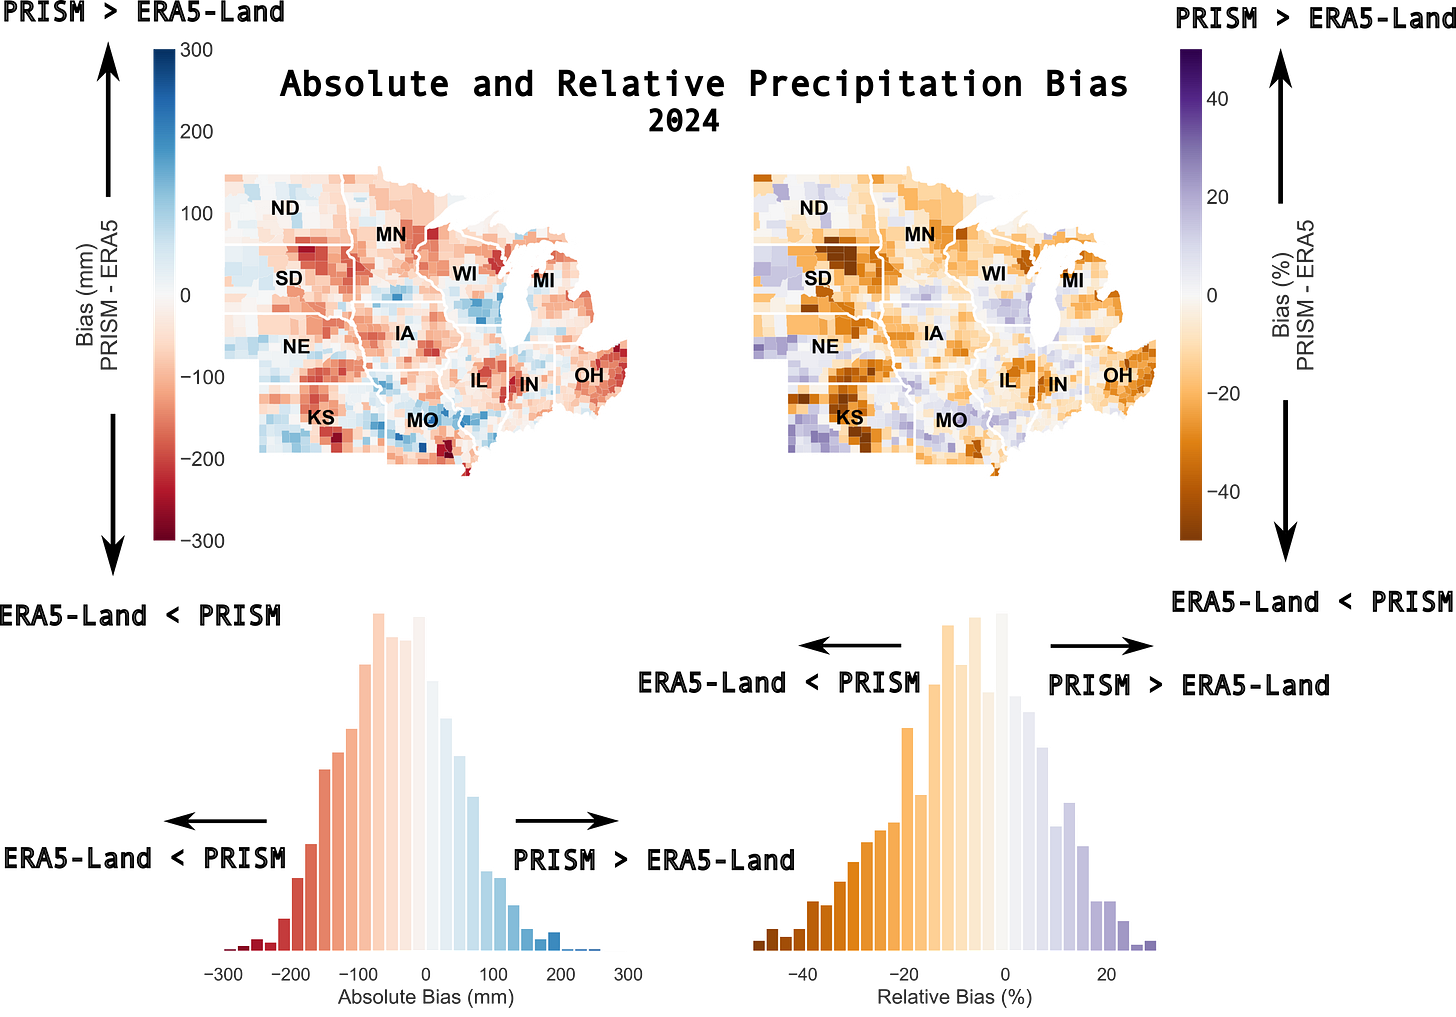
I’ve chosen to overlay the histogram visualization here to emphasize that the bias is not symmetrical: for 2024 we see that over the corn belt, the skew of the histograms towards the left indicate that ERA5-Land precipitation estimates tends to be larger than PRISM precipitation estimates on average.
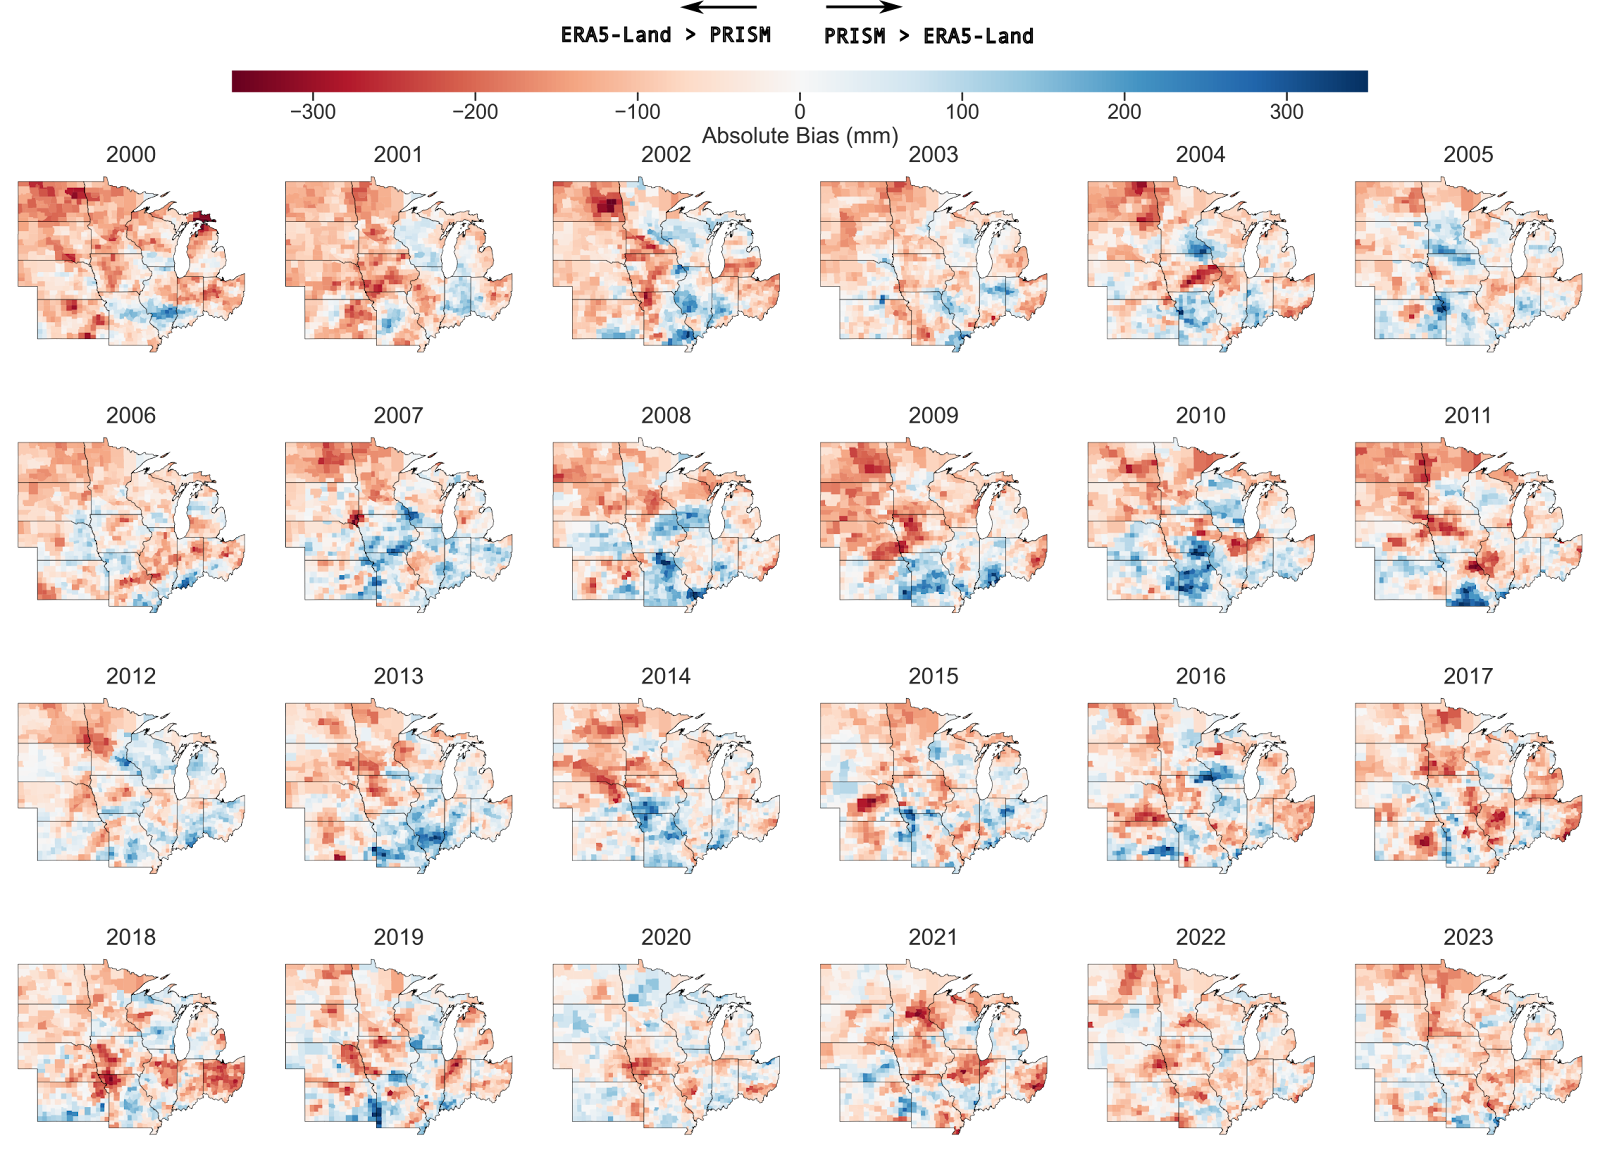
Extending this further to all years: here’s what the bias between PRISM and ERA5-Land precipitation looks like year over year:
Perhaps more telling is the relative bias, which shows us that there are large discrepancies (>40%) between the two datasets every year. In particular we see that North and South Dakota appear to be consistently biased much lower.
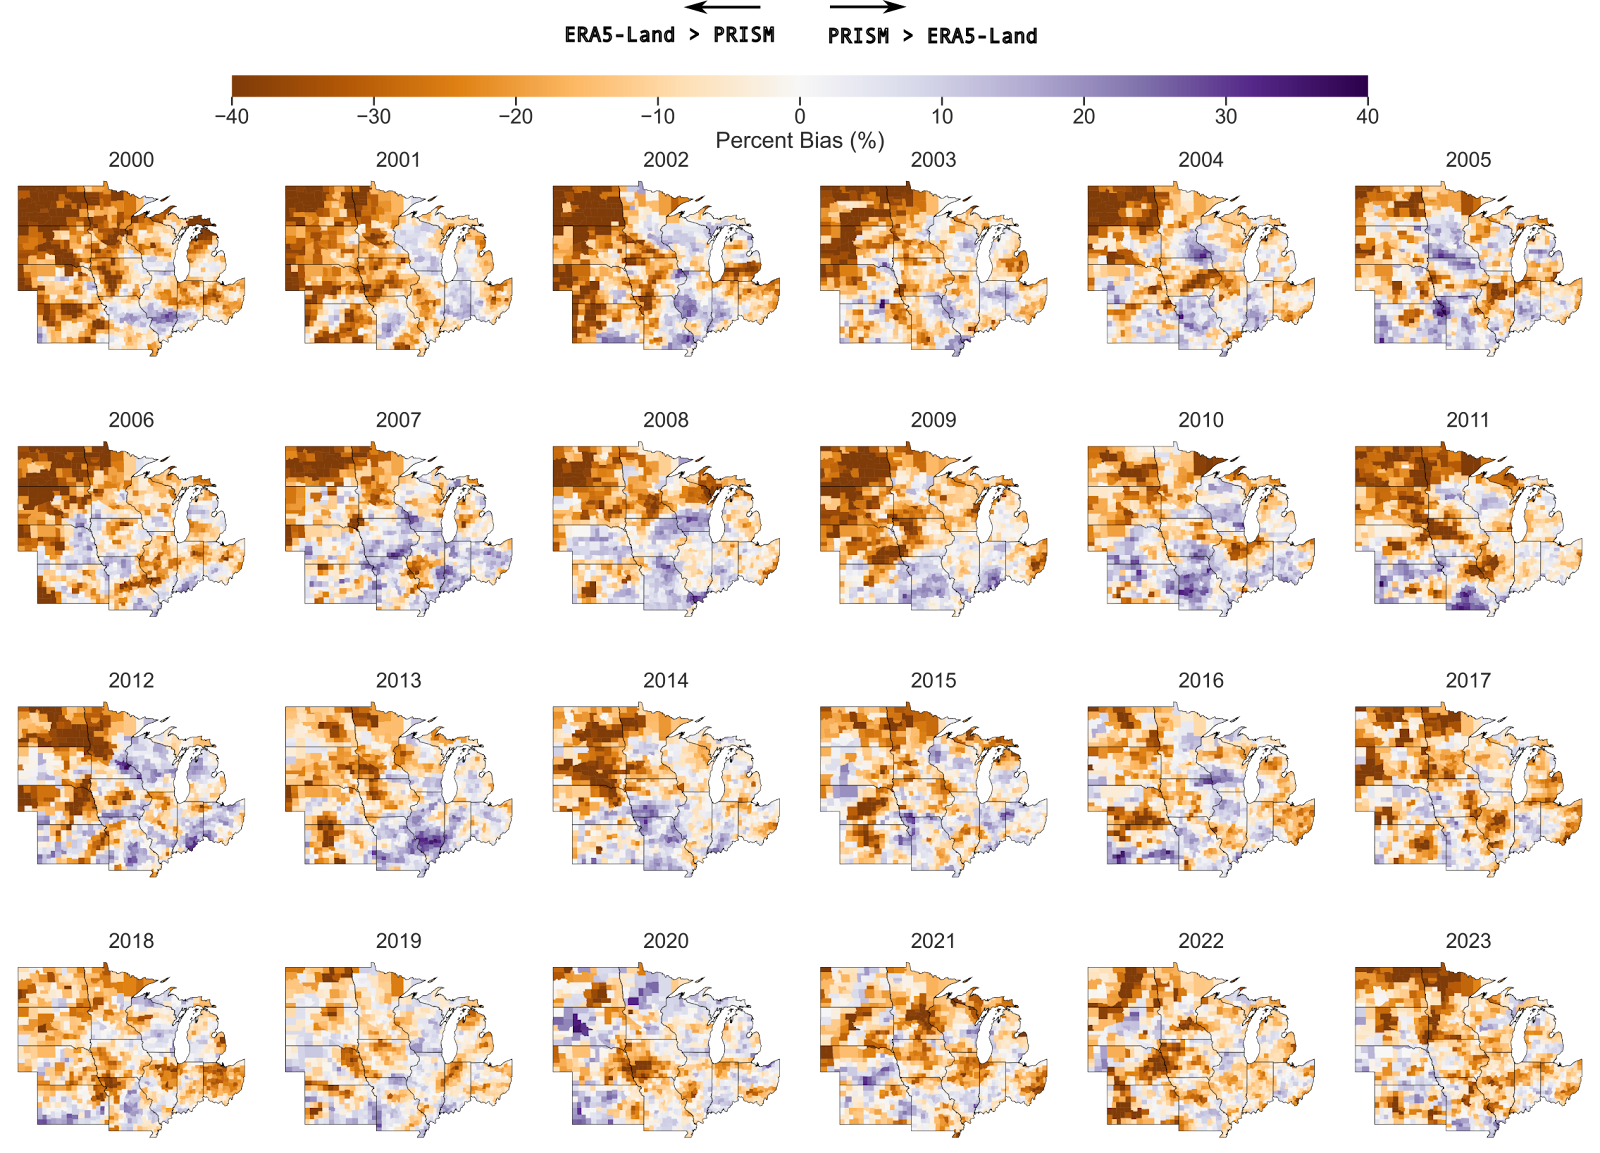
The overall bad news is that the bias between the two datasets seems both spatially and temporally variable: models trained on these datasets are likely to be very, very different, and learn very different relationships!
The take aways here are:
Comparing temporal gridded datasets is a surprisingly complex task, a bitter lesson I learnt writing this blogpost which I thought would be an easy engagement-farming win and a fast ticket to geospatial influencer-stardom.
There is a huge amount of variation between PRISM and ERA5-Land: for some growing seasons we’re talking > 400mm or > 40% difference!
Not only is this variation large, it changes over time too!
⌛🗺️ Aggregating in time, and comparing in space
Another way we can look at this data is simply by taking the median and standard deviation of the annual bias over all of the available years. Taking the median is a way of reducing this problem to how these datasets diverge from one another on average in our time period. The standard deviation on the other hand tells us about how variable the difference between these datasets tends to be year over year.
In counties shown in red below, PRISM precipitation accumulated from March - November exceeded that of ERA5-Land on average over the years. The opposite is true for blue counties. Looking at the data this way allows us to see that over the corn belt, ERA5-Land precipitation tends to be higher than PRISM in the period 2000 - 2024, as evidenced by the asymmetry of the histogram of median biases around 0.
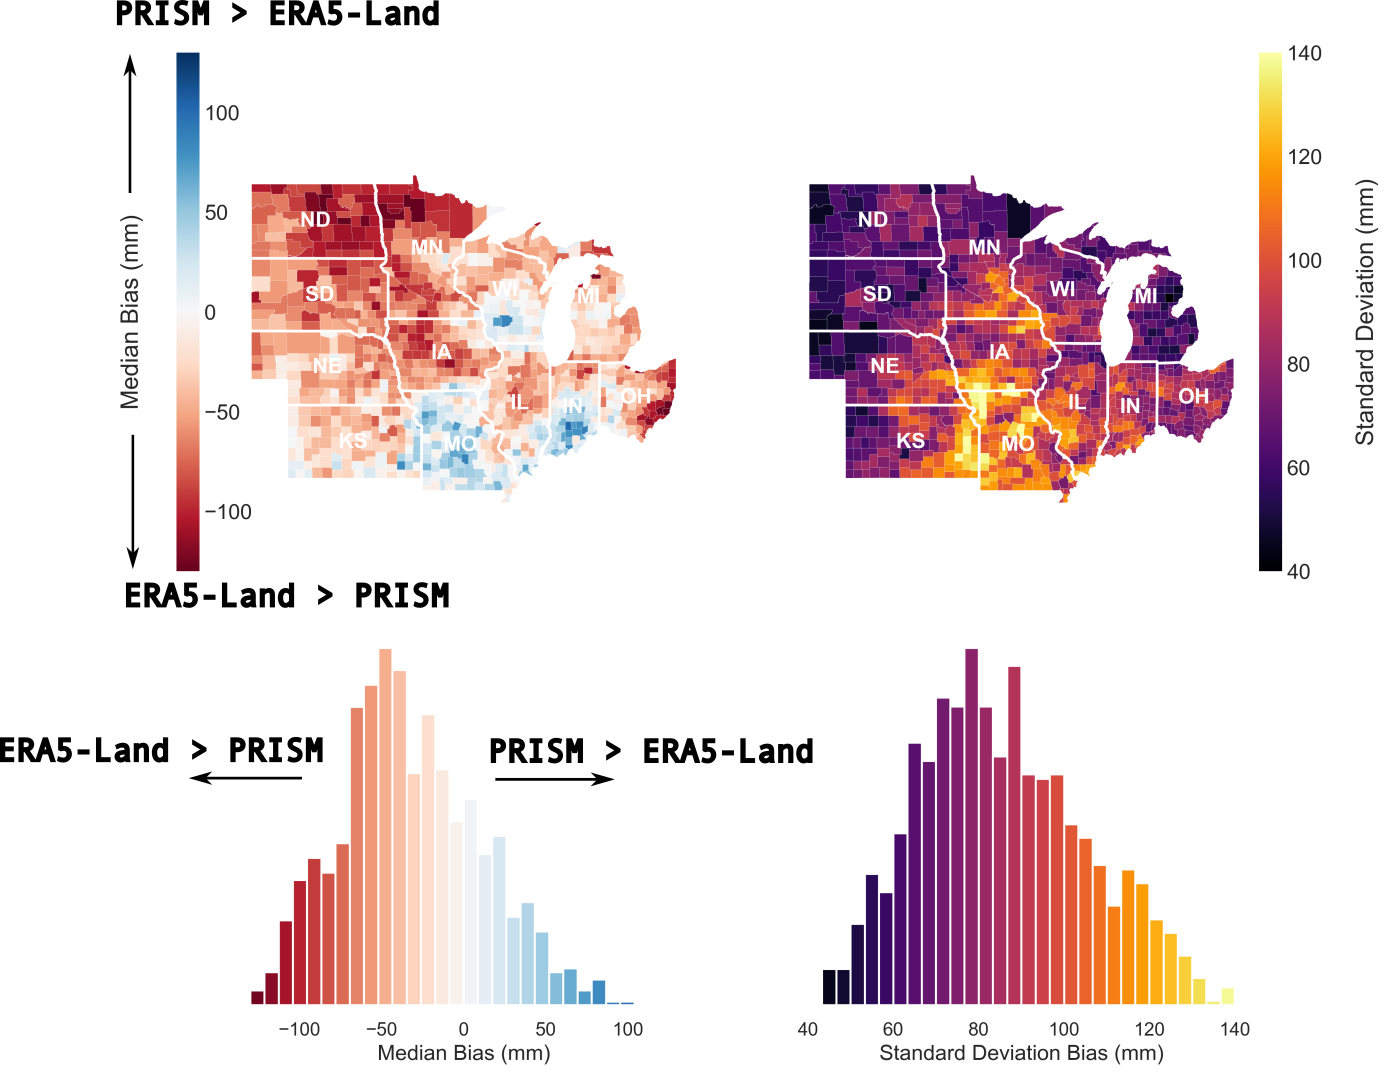
Interestingly we also see a bit of a north-south bias, with ERA5-Land overestimating precipitation in northern regions (ND, MN) relative to PRISM, and the reverse being true in southern states (MO, IN). Likewise, we can also see that the bias between our two datasets appears to be particularly unstable in some regions: along the state borders of Missouri with Iowa and Kansas. A high standard deviation in precipitation bias indicates a large spread in the bias between our precipitation datasets over the years, indicating that the bias is unstable with respect to time: some years the bias will be large, and others small. A smaller standard deviation value indicates a lower amount of variation year over year.
Conclusion
To flog this dead horse one last time: I think it’s pretty clear that these two datasets diverge pretty significantly, in almost every way imaginable. It’s important to realize that this divergence can impact our understanding of the relationship between weather, crop yields, and associated climate impacts.
FWIW it seems that PRISM seems like the gold standard in the US in terms of weather data, but many countries do not have an equivalent, and yield models are likely to use ERA5-Land/ERA5 in those areas. This raises the question of whether we can truly trust the significance and relationships uncovered by data-driven models between weather variables and targets such as crop yields.
As usual, I’m complaining about these issues, but don’t really have a solution. If you’re aware of any higher-quality datasets outside of the US that are analogous to PRISM, please do drop me a note/leave a link in the comments!
In a follow-up post, we’ll have a look at implications at the differences between these datasets on estimations of extreme weather, and their potential effect on corn yield models. Another thing to note is that we’ve only touched on a single variable, precipitation, from these datasets. Stay tuned for some analysis on how temperature, a key input into crop models can vary between ERA5-Land and PRISM!
Please consider subscribing to make sure you don’t miss out on any posts!
Do you have any indications of why the predictions differ so much? I'm only passingly familiar with the two datasets, but as an example you noted a north-south trend, but I'd note there's also a roughly similar elevation trend. Precipitation correlates with elevation, and understanding this relationship is a piece of what PRISM does. It also uses elevation to predict/interpolate precipitation. ERA5 doesn't explicitly do that, afaik, and models precipitation based on satellite observations + weather stations? It's a little unclear to me exactly how it works, but it seems like looking at covariates or understanding if there's a geospatial trend in the data (e.g., due to elevation or another factor) which isn't explicitly captured in a model might cause it to underpredict, or, conversely, cause another model to overpredict if it's overfit to that same trend.